There is no GPU price
David Lopez Mateos
The headlines would have you think GPU compute prices are exploding. That’s the story, and it’s a comfortable one. It fits neatly into a macro narrative of supply crunches and insatiable AI demand, and it implies something reassuring: that we have a functioning market with legible price signals.
The headlines would have you think GPU compute prices are exploding. That’s the story, and it’s a comfortable one. It fits neatly into a macro narrative of supply crunches and insatiable AI demand, and it implies something reassuring: that we have a functioning market with legible price signals.
We don’t. That narrative is built almost entirely on a single index, and it implies something it shouldn’t: that the GPU rental market is efficient enough for one number to represent the state of play.
The supply crunch is very real, but it is experienced very differently depending on who you are, where you are, and what contract you’re trading, and what compute assets. The natural response to that opacity isn’t orderly price discovery, it’s hoarding: locking up GPU-hours you might not need yet because you can’t be sure they’ll be available next month at any price. And where there’s hoarding and no transparent benchmark, fragmented secondary markets emerge. At Compute Desk we have already facilitated renters subletting their clusters like apartments during major sporting events, so this is not a hypothesis. It’s happening. Today.
Indices that don’t converge
In mature commodity markets, indices built on different methodologies converge. Brent and WTI diverge by a few dollars on geography and crude quality, but directionally they move together (Figure 1). That convergence is the signature of an efficient market.
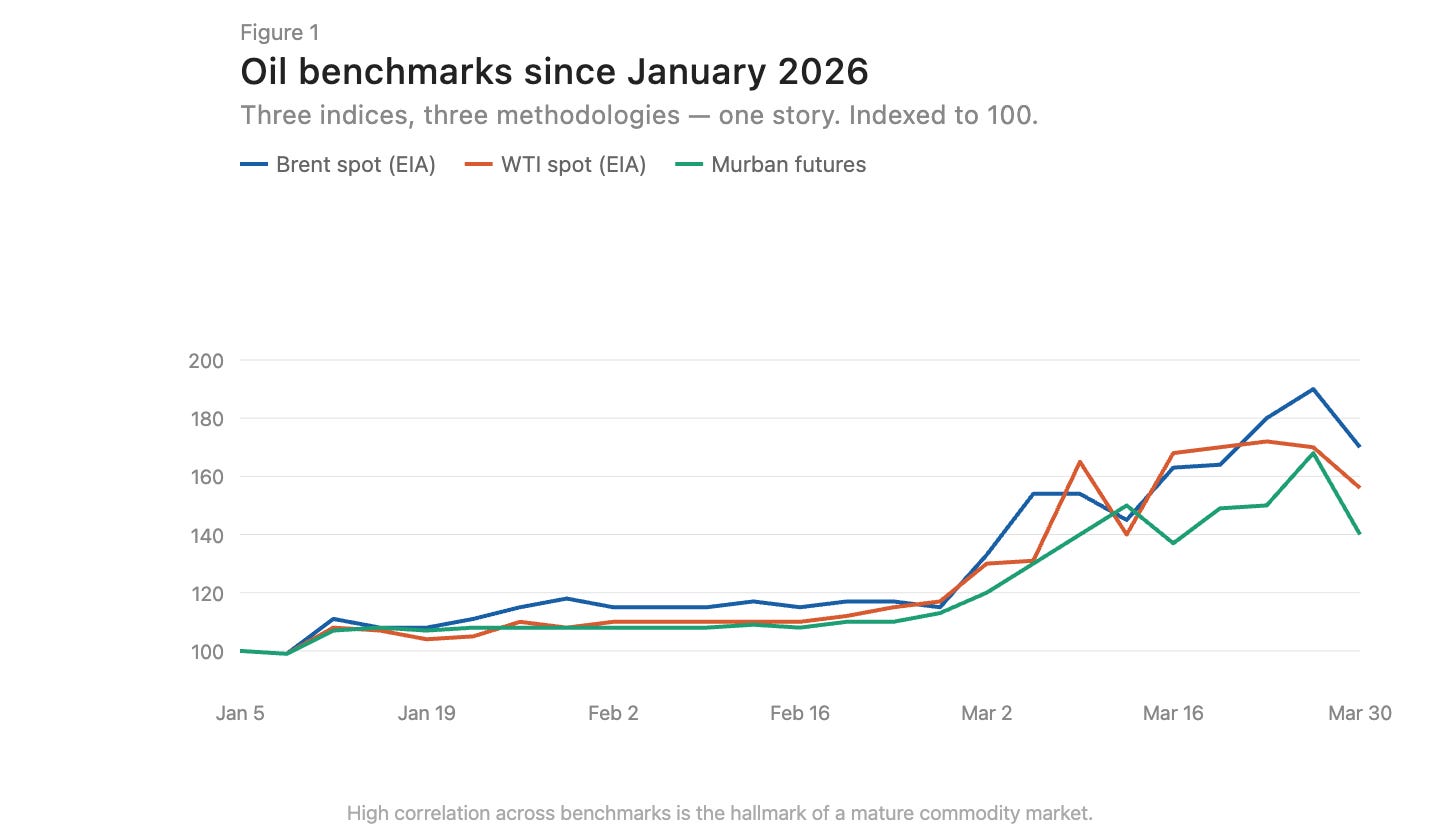
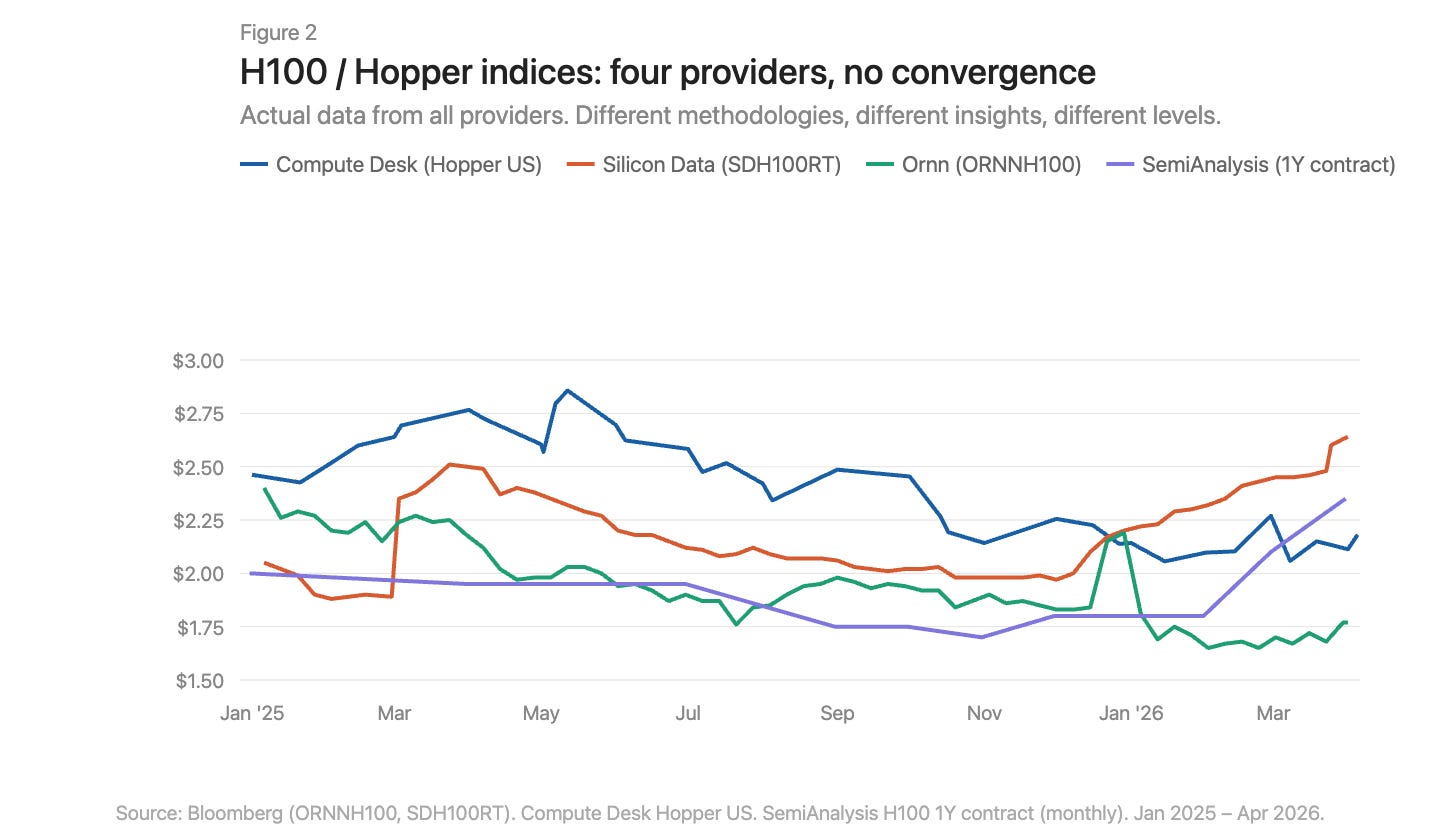
There are now three GPU pricing index providers on Bloomberg terminals: Silicon Data, Ornn AI, and Compute Desk. SemiAnalysis has just made a fourth publicly available, a monthly H100 1-year contract price index built on survey data from over 100 market participants. Silicon Data and Ornn publish daily H100-specific rental indices. Compute Desk aggregates at the Hopper architecture level. SemiAnalysis captures negotiated contract rates rather than posted or scraped prices. Different methodologies, different frequencies, different insights into the same market. Overlay them and the divergence is plain (Figure 2).
Where the increase actually lives
Using Compute Desk data, we can decompose the H100 price movement by provider type and contract structure, and overlay it against Silicon Data’s SDH100RT (Figure 3). All show prices rising, but the starting point and magnitude differ sharply depending on which index and which contract type you’re looking at.
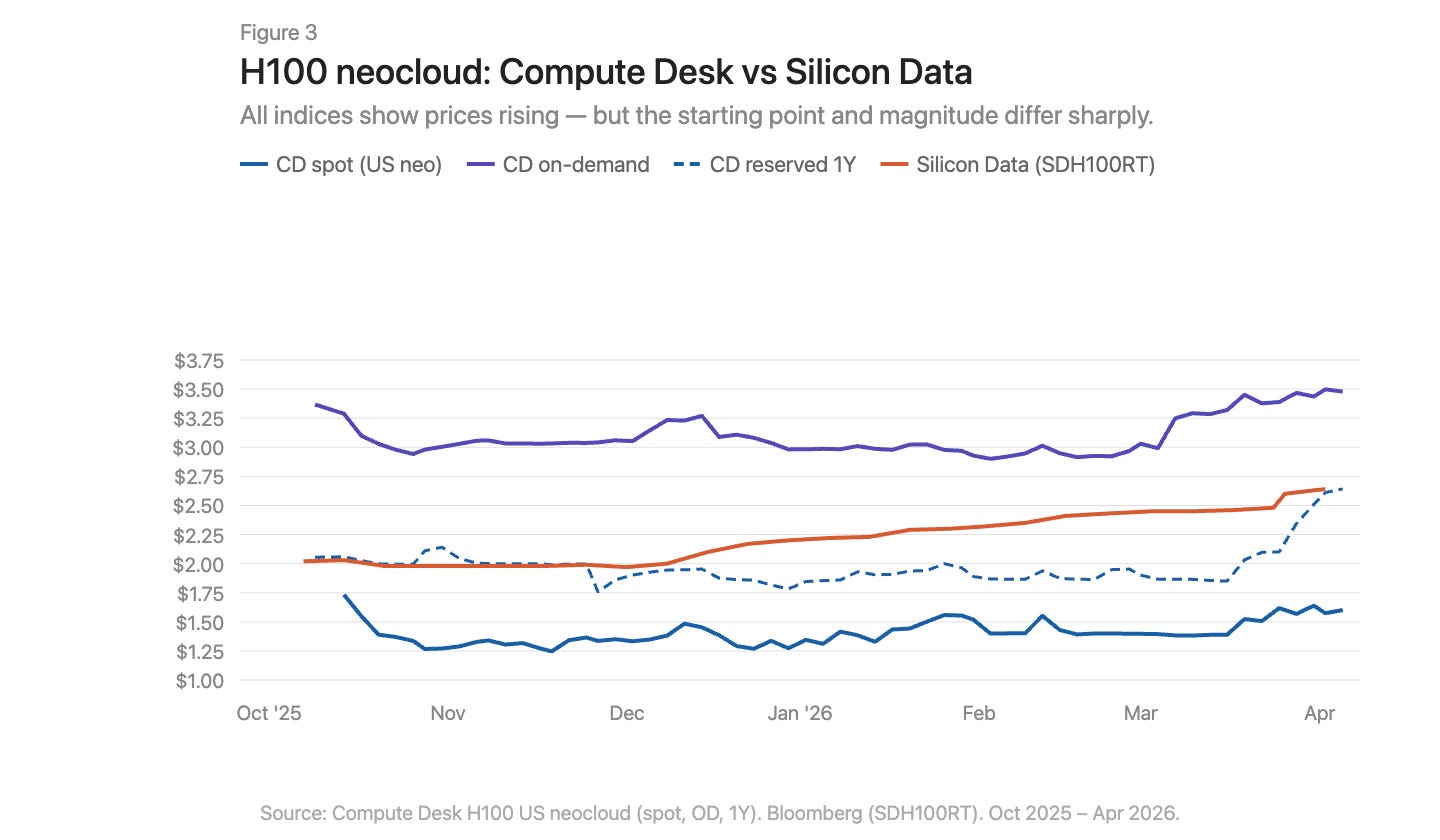
The Compute Desk H100 neocloud data tells a more specific story than the aggregated indices suggest. On-demand pricing was relatively stable through the winter at around $3.00/hr, then spiked sharply in March to $3.50. Spot pricing is noisier and lower, without a clear directional trend until a modest uptick in March. Silicon Data’s SDH100RT, shows a smoother, steadier climb from $2.00 to $2.64 over the same period. The two indices sit at persistently different levels and tell different stories about timing: CD says March spike, SD says gradual ramp.
Reserved 1-year pricing was flat through February, then surged in late March from $1.90 to $2.64 — not a gradual catch-up but a sharp, sudden repricing. That’s consistent with providers resetting contract rates in response to on-demand tightness, not with sustained structural demand.
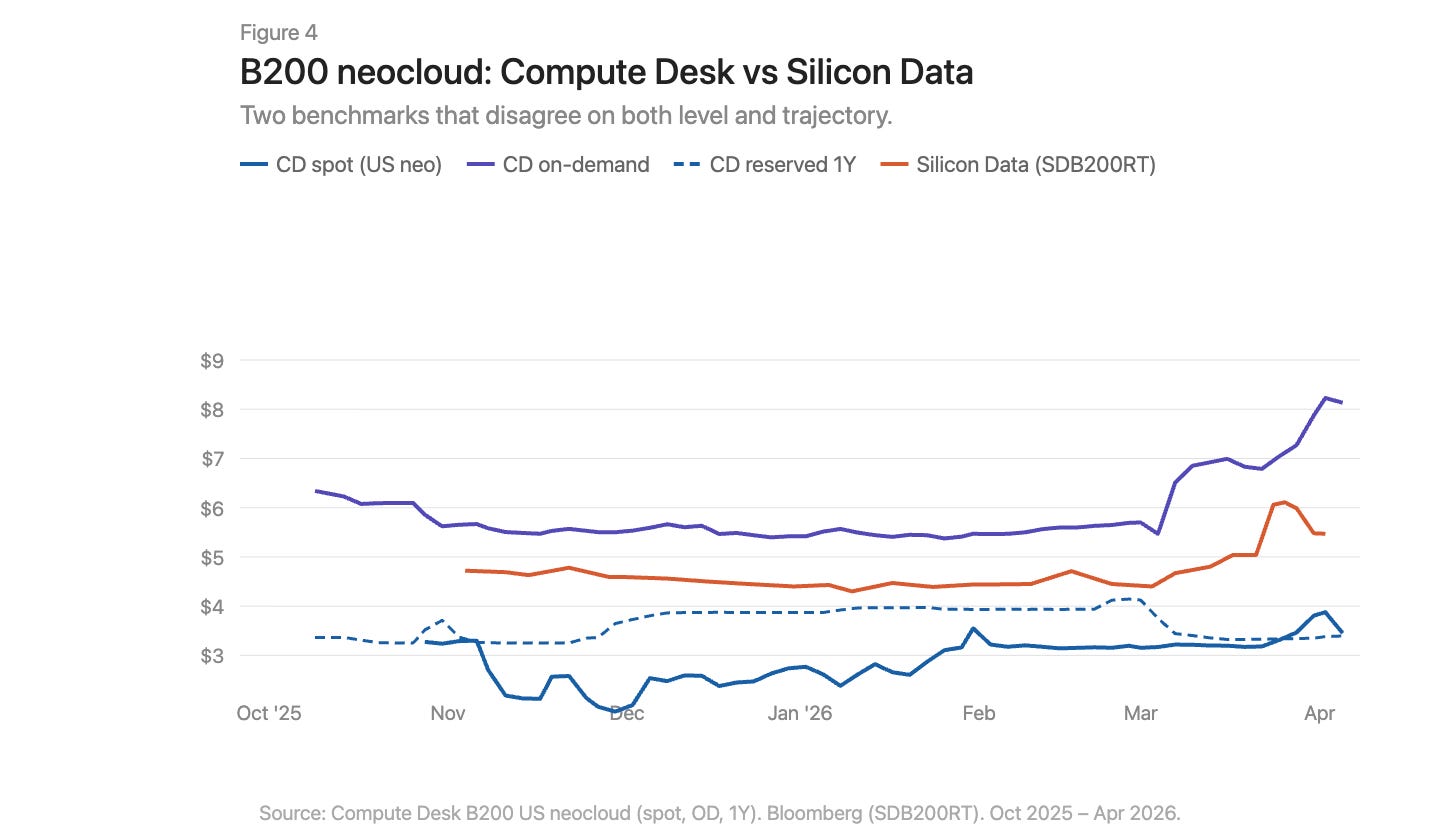
For the B200, the March story is louder still (Figure 4). Compute Desk’s on-demand index exploded from $5.70 to over $8.00 in the space of weeks. Silicon Data’s SDB200RT spiked from $4.40 to $6.11 before pulling back to $5.47. Both indices registered the move, but from levels more than $2.00 apart and with different shapes on the way up and down. With barely five months of history, fewer providers, and wider spreads, the B200 indices are measuring the same event through very different lenses.
Infrastructure, not just regionality
Commodity markets have basis differentials. Appalachian natural gas is the textbook case: massive reserves sitting on top of structurally constrained pipeline capacity, with utilisation on the Pennsylvania–Ohio corridor routinely exceeding 100% and new projects like the Borealis Pipeline not coming online until the late 2020s.
There’s a version of this in GPUs: an H100 in Virginia is not the same economic good as one in Frankfurt. But regionality alone doesn’t explain why indices built to measure the same market diverge as much as they do. The GPU market’s dislocations run deeper than Appalachian gas. There, the problem is a single missing link: pipeline capacity between supply and demand. In compute, the infrastructure gaps are on both sides. The physical infrastructure to distribute compute reliably (consistent networking, predictable configurations, predictable availability) is immature and sometimes simply ineffective. And the financial infrastructure that would compress spreads in spite of those physical differences (standardized contracts, transparent benchmarks, arbitrage mechanisms) doesn’t exist yet either.
The data tells one story. The lived experience of trying to procure compute in early 2026 tells a more visceral one. On-demand capacity is effectively sold out across all GPU types. Hunting for even 64 H100s is a struggle: Compute Desk shows zero availability in on-demand clusters for 90% of providers, and the reserved market is not much better. In a well-functioning market, that level of scarcity would have already driven prices to a new equilibrium. It hasn't. This suggests suppliers themselves lack the real-time pricing intelligence to adjust. Prices are rising, but they're rising too slowly to clear the market, and the gap between posted rates and true willingness-to-pay is being filled by hoarding, subletting, and informal secondary deals.
What needs to change
No consensus benchmark. Multiple indices exist, with different methodologies, and they disagree.
Aggregate narratives obscure structure. A single number for “the price of an H100” hides variation by provider type and contract term.
Scarce transaction-level data. Posted prices and clearing prices diverge massively in bilateral markets.
No contract standardization. Most GPU rentals are negotiated bilaterally with idiosyncratic terms. Shorter, more standardised tenors would improve liquidity and price discovery.
No certainty on delivery quality. Interconnect topology, CPU pairing, networking stack, and uptime vary enormously. Buyers need to know what quality of compute they’re purchasing before they commit.
Contracts are illiquid. If your needs change mid-reservation, your options are limited: eat the cost or informally sublet. The market needs infrastructure for transferring or reselling committed compute so that capacity flows to whoever values it most.
No forward curve. You can’t hedge what you can’t price forward. This is why lenders apply 40–50% haircuts to GPU collateral and why financing costs remain punitive.
Assembling a functioning market for the most important commodity of the century won’t happen on one front. Measurement, standardization, contract structure, delivery quality, and liquidity all need to advance together before anyone can credibly claim to know what a GPU-hour is worth.